Data and Insights
Viewing, streaming, FAST and advertising data, with sources and definitions.
Viewing Share
Where television viewing happens
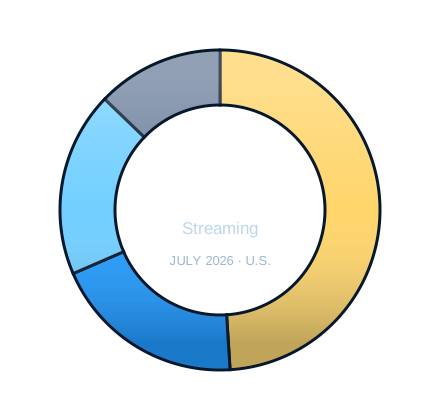
U.S. Television Viewing Mix
July 2026 · Share of total television use
- Streaming49%
- Broadcast19.5%
- Cable18.7%
- Other / remainder12.8%
Source: Nielsen, The Gauge — July 2026. Reporting interval: June 29–July 26, 2026. Original Broadcast Workflow graphic. Other / remainder is calculated as 100% less the three reported categories.
YouTube accounts for 14.2% of total TV use and is included within streaming. Distributor shares are another view of the same television total and must not be added to the platform categories.
| Additional measure | July 2026 | June 2026 |
|---|---|---|
| YouTube · total TV share | 14.2% | Not supplied |
| NBCU–Versant · distributor share | 9.2% | 9.1% |
| FOX · distributor share | 7.8% | 7.4% |
| Streaming · total TV share | 49.0% | 48.5% |
June values are derived from the share-point changes in Nielsen’s release. The July interval covers total U.S. TV viewing; this is not an advertising currency ratings comparison.
Streaming Engagement
Roku streaming hours
Streaming across the Roku platform rose 7% year over year. This covers the whole platform, rather than The Roku Channel alone.
Billion hours streamed. Exact values are provided in the table below.
| Period | Streaming hours |
|---|---|
| Q2 2025 | 35.4 billion |
| Q2 2026 | 37.9 billion |
Source: Roku — Q2 2026 Form 10-Q. Same-quarter comparison; not sequential-quarter growth.
FAST Channel Carriage
FAST platform listings
Channel carriage counts describe platform availability, rather than audience size or unique channels across the market.
The March–June 2026 comparison is awaiting source verification and data-use review. Figures will appear here when that review is complete.
The workbook tracks Samsung TV Plus, Roku, LG Channels, Tubi, Xumo, Vizio, Pluto and Prime Video. Platform coverage, geography and local-station rules can affect comparisons.
Source to review: FASTMaster Intelligence — FAST Directory: March to June 2026.
Advertising Revenue
U.S. internet advertising revenue
Annual U.S. internet advertising revenue, across all digital formats. These totals include formats beyond television and CTV.
USD billions. Exact values are provided in the table below.
| Year | Revenue (USD billions) |
|---|---|
| 2021 | 189.3 |
| 2022 | 209.7 |
| 2023 | 225.0 |
| 2024 | 258.6 |
| 2025 | 294.6 |
Sources: IAB / PwC — Internet Ad Revenue FY2025; IAB/PwC 2024 release; IAB/PwC 2023 release; IAB/PwC 2022 report.
Roku advertising revenue
Q2 2026: $673 million (rounded from $672.8 million). This is Roku’s reported advertising revenue, not total CTV market spending.
Source: Roku — Q2 2026 shareholder letter.
Data snapshot checked October 20, 2026. Each dataset retains its own reporting period. These historical figures do not update automatically.